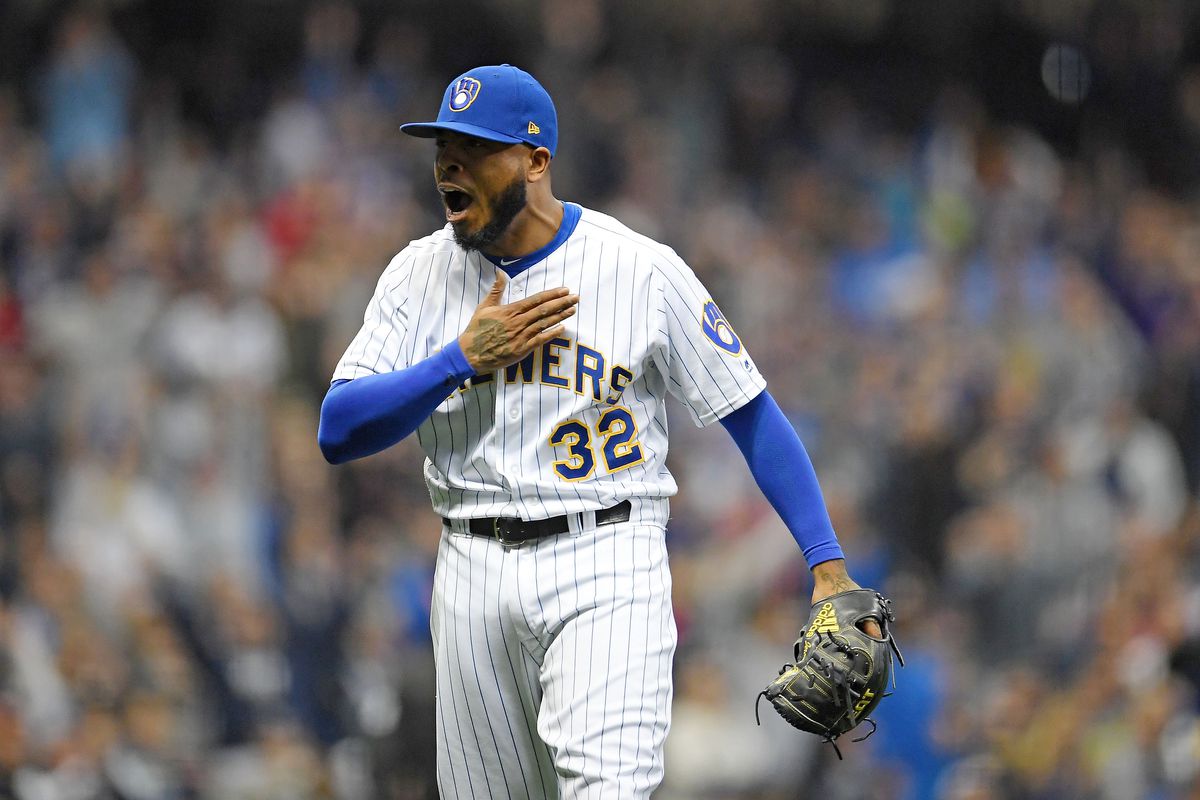
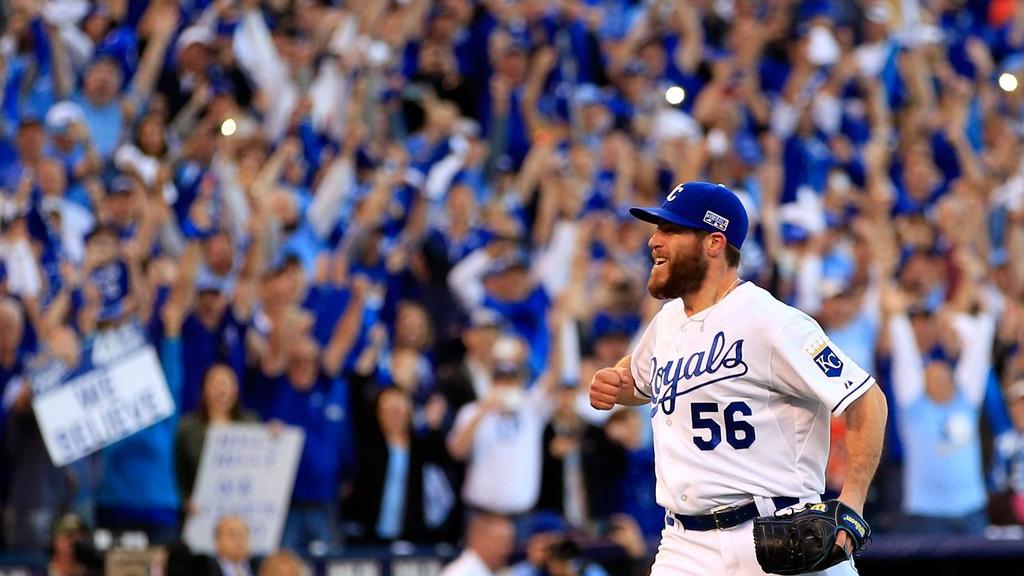
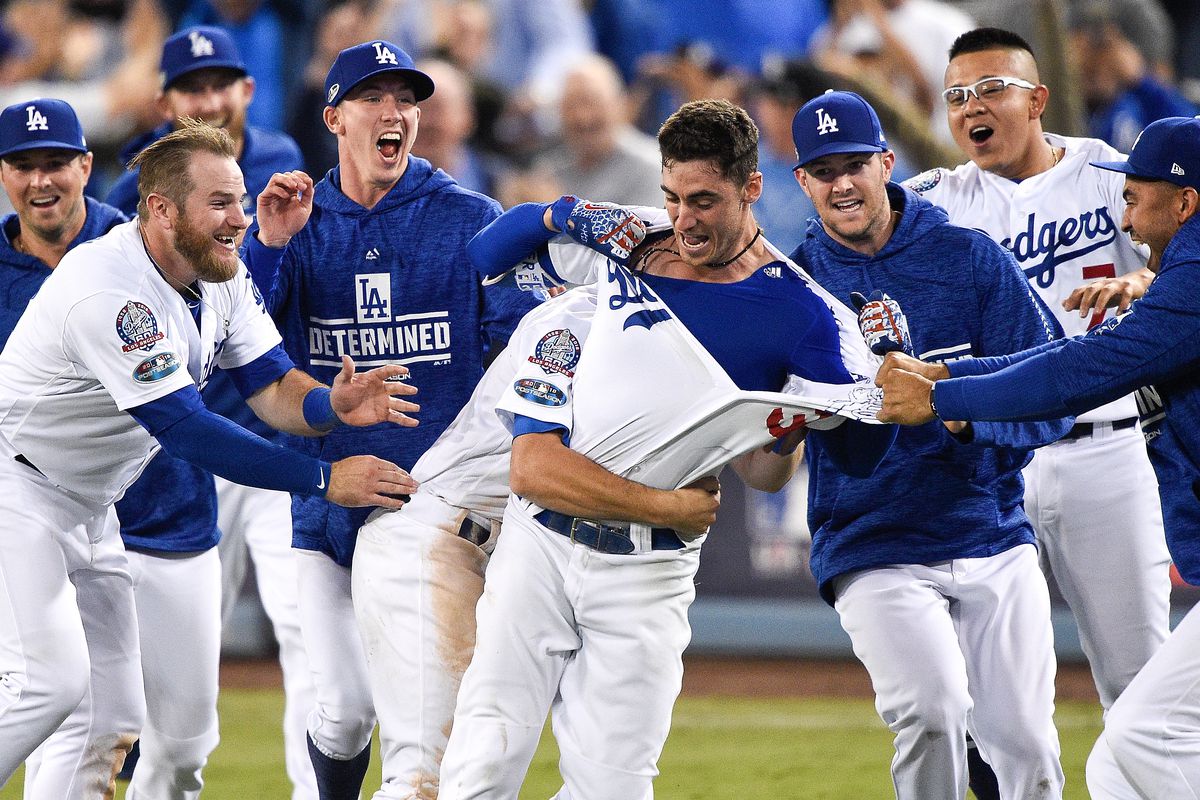
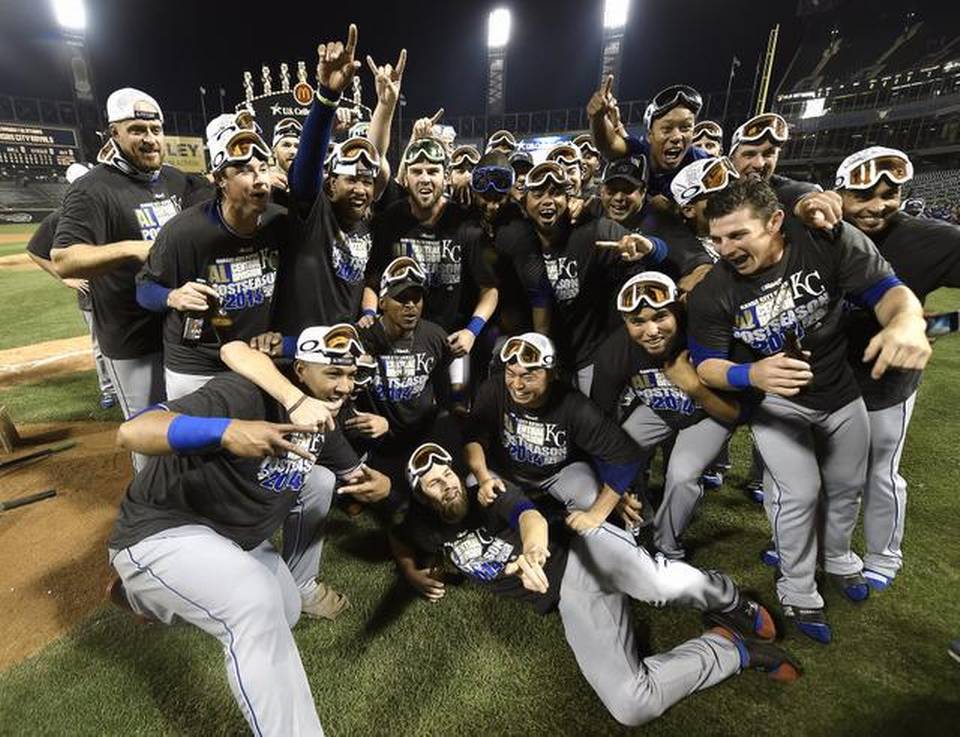
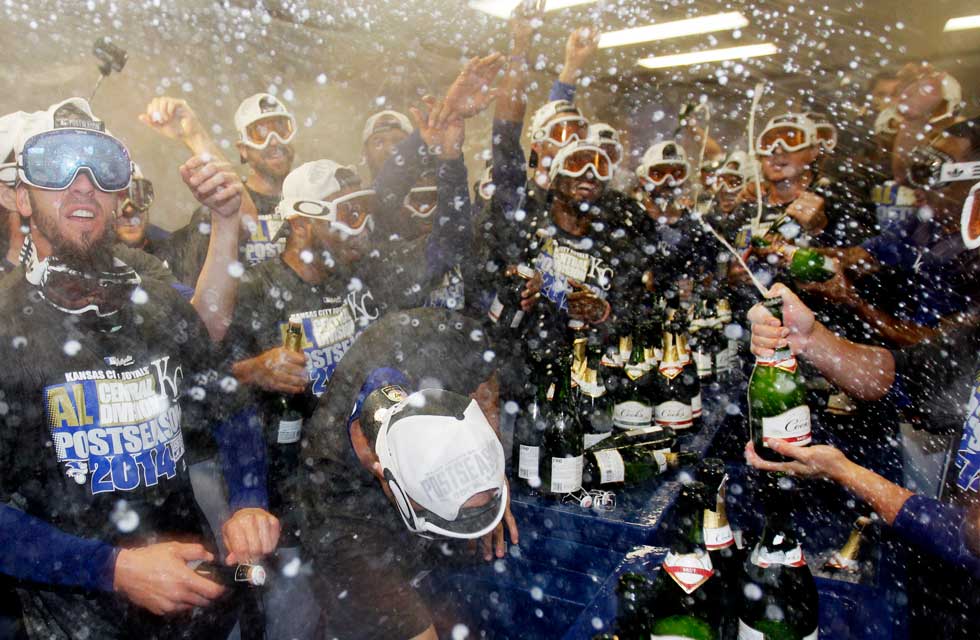
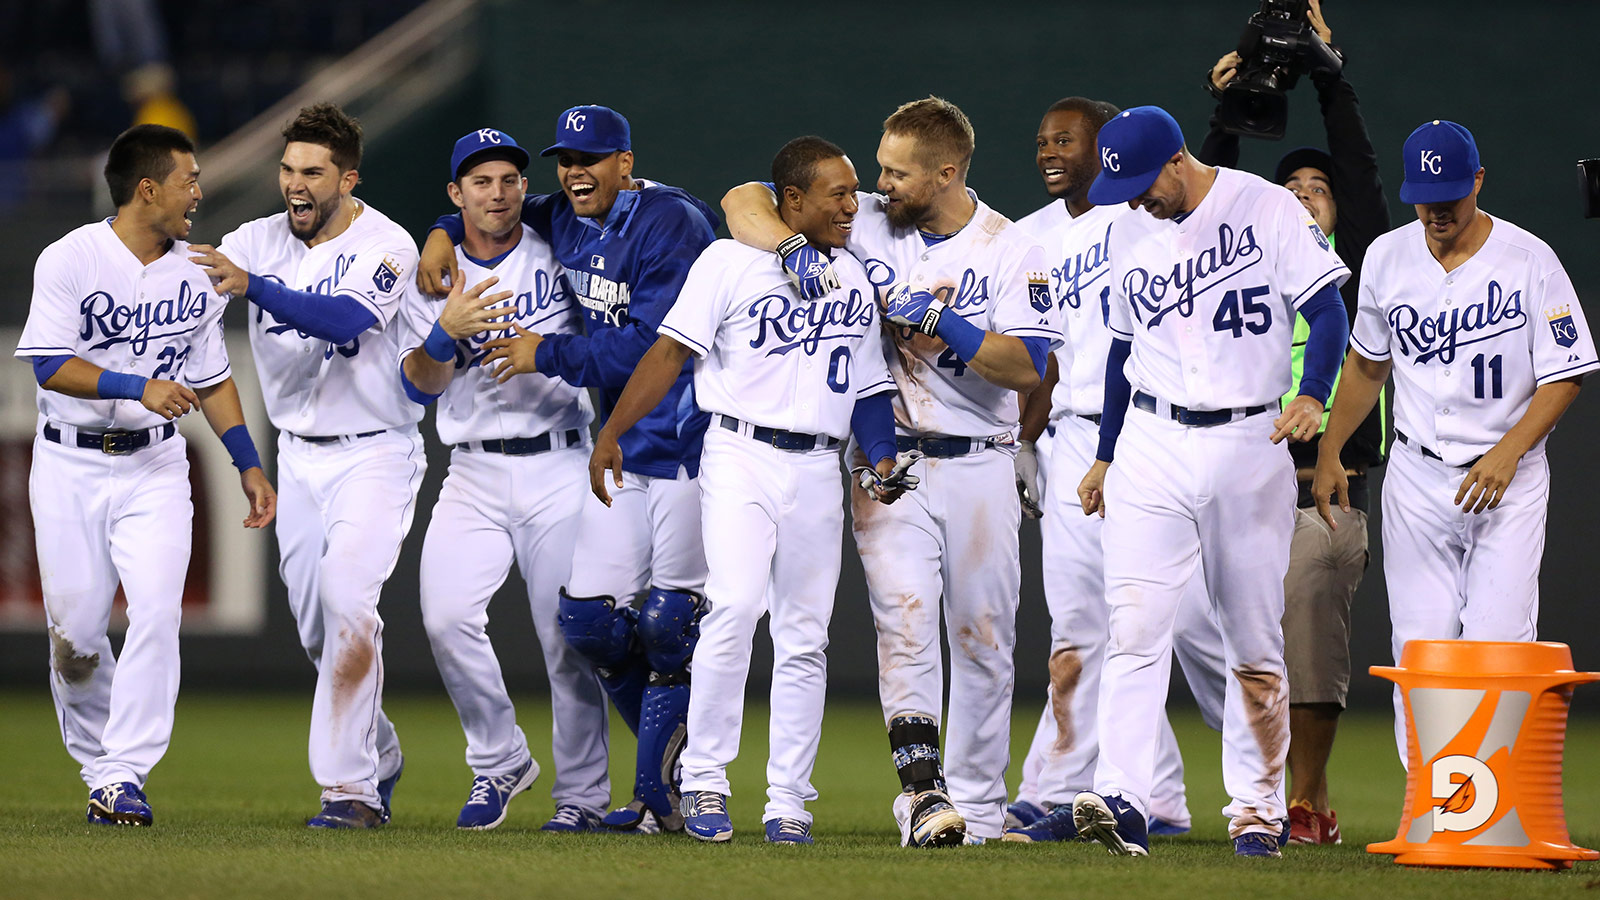
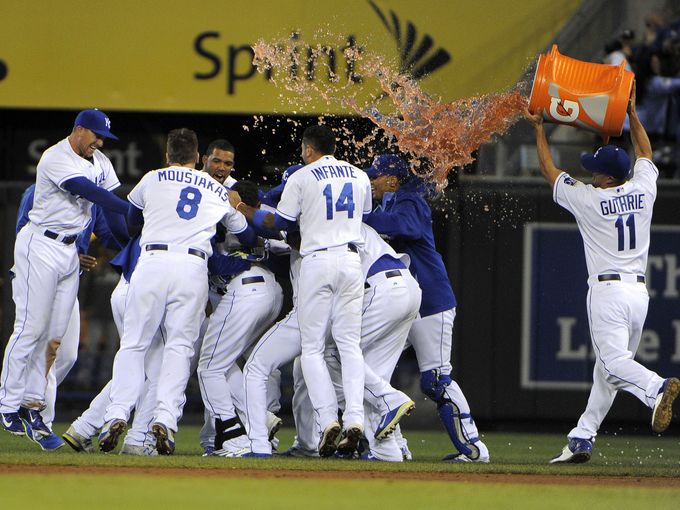
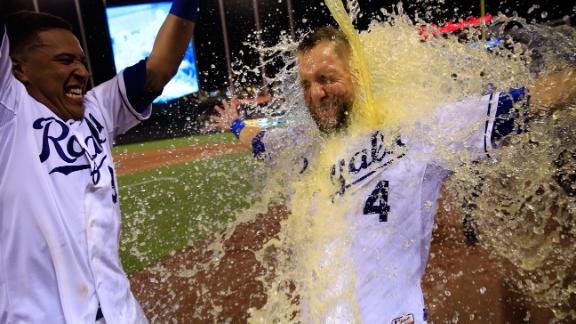
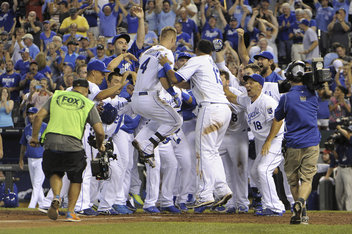
Like most Kansas City Royals fans, I’m still in a bit of shock that the team is in the postseason. The expectation was that they would be better this year (how could they be worse, right?) but expecting a 30 win increase felt very unrealistic. But here we are. Not only have the Royals reached the postseason, but they won their Wild Card matchup against the Baltimore Orioles to move on to the American League Divisional Series.
The ALDS started on Saturday night in New York, as the Royals are taking on their back-in-the-day rivals, the New York Yankees. The Yankees came away victorious on Saturday night but not without a little bit of controversy. If you still scan the wasteland of Twitter (and yes, I refuse to call it by any other name) you probably saw a lot of opinions on not only the umpiring in the game, but also replay, MLB and even the Yankees. So today, let’s take a look at some of these opinions and sort out the difference between reality and opinion.
MLB Doesn’t Want the Royals to Win

This has been a popular narrative for years, that Major League Baseball doesn’t want the smaller market teams to win, instead hoping the larger markets win out bring their larger fanbases with them. If we are being honest, there is probably a bit of truth here, although I would argue the TV networks want this more than MLB. There is something to be said for the smaller markets to come out victorious, as people love rooting for an underdog.
In this argument, the Royals are the obvious underdogs while the Yankees would be that large market that television networks covet. If some of you remember (and I’m sure a number of you do), the Royals were in this position back in 2014 and 2015 and I don’t believe the numbers for the World Series either year tanked. Having the variety in the playoffs is a plus and one that allows a number of different fanbases to not only cheer on their team but also be part of October baseball.
I’m sure there are certain scenarios that MLB would love to see, whether it be for ratings, attendance or even social media activity. Sometimes it doesn’t even have anything to do with a team or market as much as compelling action that makes it harder for any fan to turn away. At the end of the day, MLB wins either way, whether it is is the ‘Up and Coming’ team or the teams you love to hate (I’m looking at you, Yankees/Dodgers/Astros). So the narrative that MLB hates your team…well, I just don’t believe that is true.
The Umpires Wanted the Yankees to Win

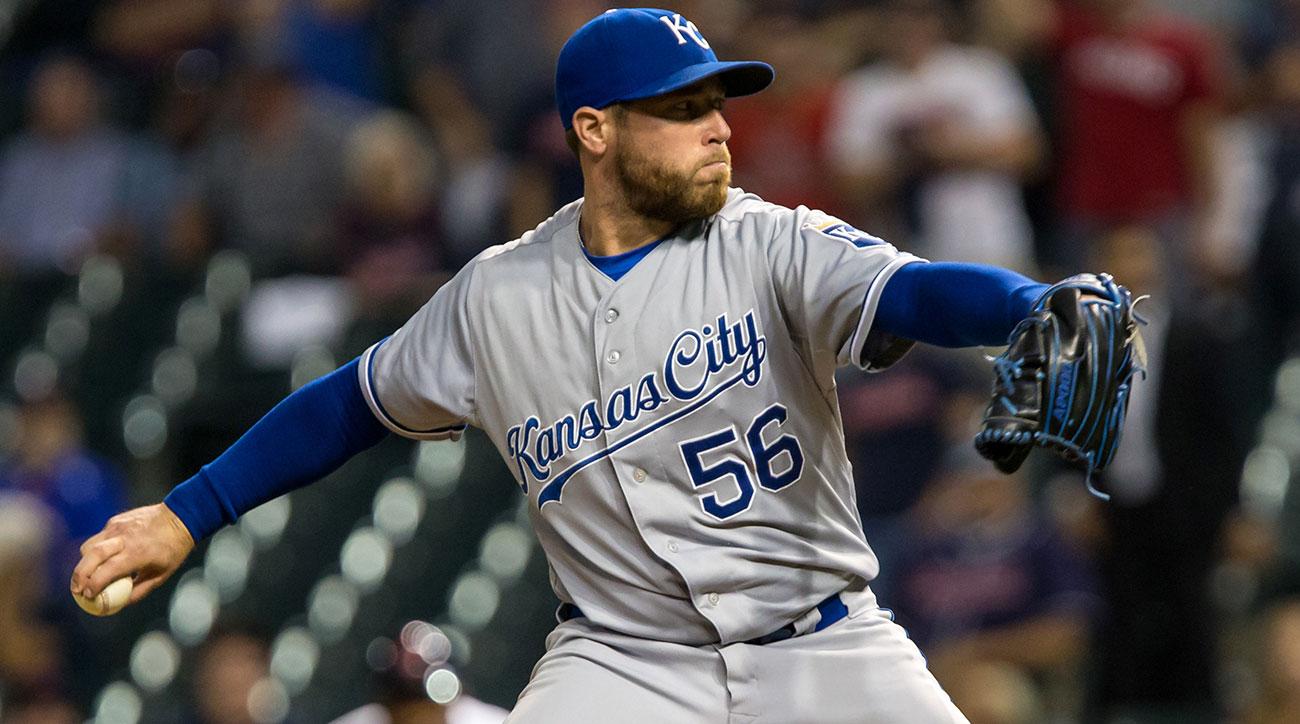
One of my big pet peeves in sports is fans laying the blame for their team’s woes on the officiating. To me it’s a cop out and ignoring the things your team did wrong in the game. Nine times out of ten, there is an easier explanation as to why the game turned out the way it did and it normally has nothing to do with a bad call on the field. So how did the home plate umpire do on Saturday Night?
So overall, the ump called a pretty good game. I do feel like there are a couple of things here that should be addressed. First off, yes, there were a few calls that were missed & in crucial parts of the game. While it’s not great, it does happen & if it turns into walk, that also means three balls were thrown before then that got you to that point. This is why most baseball experts insist on throwing strikes.
Second, there were a few calls that while they might have slightly looked outside of the strike zone & were called strikes, this was being called for both teams. The pitch that was called strike three on Bobby Witt Jr in the ninth? That pitch was being called a strike to Juan Soto as well. To me, as long as an ump is fairly consistent, I’m not going to complain.
Finally, while the box for the strike zone we see on TV is close to accurate, it is not 100%. I’ve always looked at it like anything around the edges that pretty much hugs the box is probably a strike. You might be wondering why they don’t just make the box accurate? It’s because the zone is technically an invisible thing that while we know essentially where it is, it can also be up for interpretation. Also, every outlet (Fox, TBS, ESPN, Bally, etc.) has a different size box for television. So when you are watching a game, just remember there is some leeway to the zone you are seeing & you shouldn’t take the box as a literal thing. But then again, what would we have to argue about then?
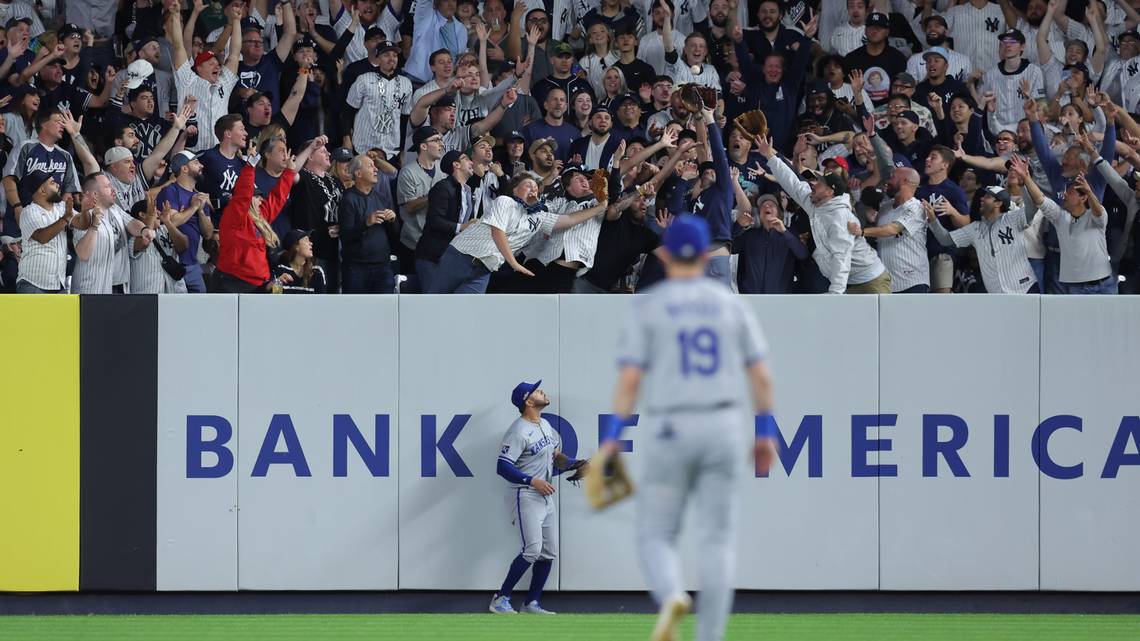
Replay Screwed the Royals

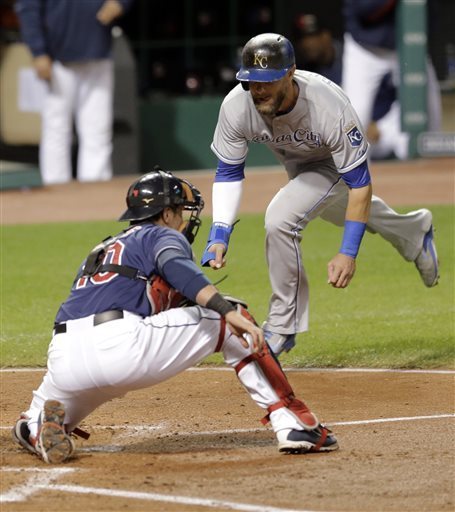
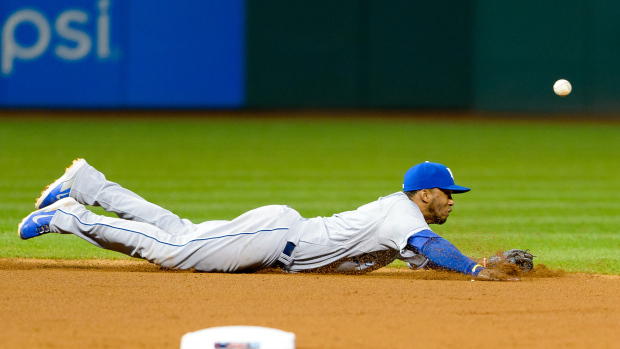
This is the narrative that has gotten the most traction & it is easy to see why. In the bottom of the 7th inning, Jazz Chisholm Jr was on first when he attempted to steal a base:
So on the replay it did look like Chisholm was tagged before he touched the base. It was hard to tell, as the play was close & most of the angles made it to where you couldn’t tell. There was one angle where it looked like Michael Massey tagged him just a hair before he got to the bag, but it very much felt like a bang-bang play.
I instantly said ‘They aren’t going to overturn it’. I’ve watched a lot of baseball over the years. The last couple years, I am normally watching a game every day. I am the diehard fan who will just watch a game to watch a game. What I can tell you from watching all those games is that normally when a play that is thisclose happens, on replay it comes back as the call stands, due to not having clear and concise evidence that they should change the call. It is almost like clockwork, to the point that it feels very predictable.
Now realize, I am not saying this is right or that we should just accept that. What I am saying is that it’s been like this for years and MLB appears to have no issue with it. With a call like that being so close, it’s hard for me to get too upset that it isn’t reversed. Yes, I would have liked for it to be turned over but I am realistic in recognizing that it probably won’t happen.
I also believe they should have non-umpires in the review room for replay to help make those calls. As of now, there are umpires reviewing the plays & making the decisions. Umpires that know the other umps who are calling the games they are reviewing. Is there a bias there? Inherently, yes. I am not saying that reviews aren’t being overturned because they don’t want their fellow umps to look bad. What I am saying is that whether they are aware or subconsciously doing it, there is a chance they are siding with their brethren. Having a non-umpire in the room to me would just help in the decision making and help any biases.
All that being said, you are not in those situations without giving up baserunners. The Royals all game long were allowing the leadoff hitter on base for a number of those innings. Chisholm got a leadoff hit. Also, if Salvador Perez had made a better throw it wouldn’t have been as close and Chisholm would have probably been called out. Replay not overturning that call didn’t cost the Royals the game. It didn’t help but it wasn’t THE deciding factor…and it definitely wasn’t the umpires looking out for the Yankees. It was just the status-quo for MLB replay.
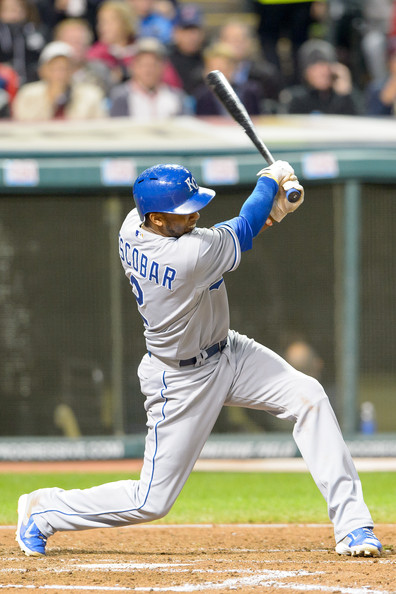
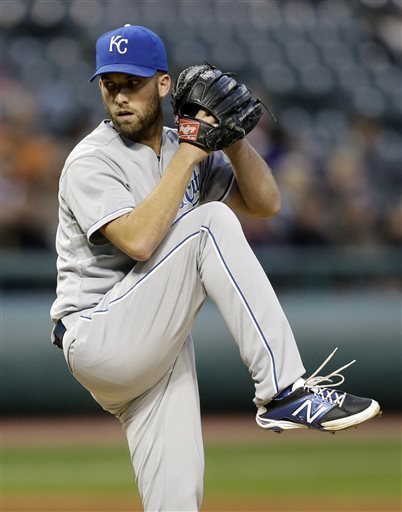
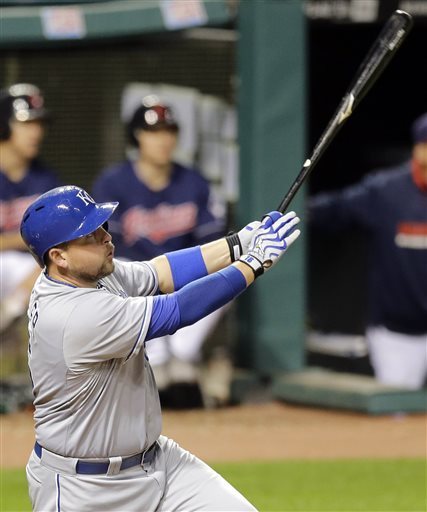
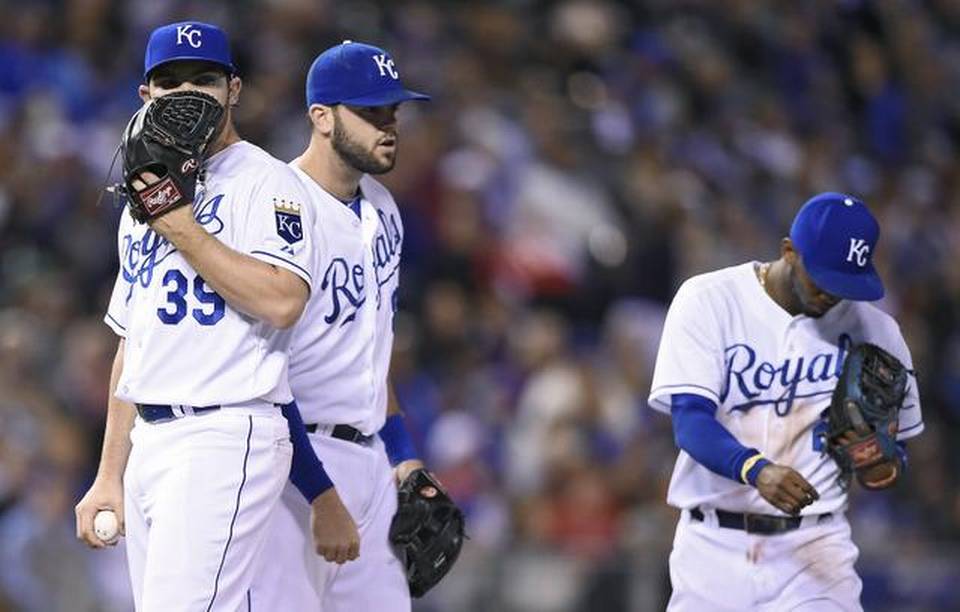
At the end of the day, the Royals lost Game 1 of the ALDS for a number of reasons. Whether it was the eight walks allowed by their pitching, or the lack of execution with runners in scoring position or even the 1 for 14 at the plate from Kansas City’s Big Three (Witt, Pasquantino, Perez) , you can find numerous reasons for why the Royals fell short in this matchup. Personally, I felt like the offense felt more alive than it has been in weeks and if the bullpen had been a little bit better we might have seen the Royals come away with a victory in Game 1. I even thought they handled Gerrit Cole pretty well, which is a good sign if this series gets to a Game 4.
People like to push a lot of narratives when it comes to big matchups like this but normally facts are the most logical way to go when analyzing the final results. It’s easy to blame an umpire, or the Yankees, or even MLB for why something doesn’t go the way you want it to. When it comes right down to it, the Yankees made a few less mistakes than the Royals and that is why they came out on top. The good news? Game 2 is Monday night. As we all know, the Royals mantra this year has been to not worry about tomorrow and focus on today. Hopefully that holds true for what we see Monday in the Bronx.